
Summary of Sizing Concepts and Architectural Alternatives
Richard K. Roth
September 15, 1996
[More about this time can be read in Balancing Act: A Practical Approach to Business Event Based Insights, Chapter 21. ERP Reporting.]Abstract
Reasons for performance problems being encountered with operational reporting and data warehouse functions in medium- and high-volume SAP implementations are described. A generalized approach for estimating reporting workload early in an SAP project is provided along with throughput metrics that can be used to assess whether performance problems are unlikely, probable, or certain. The integrated ABAP/Geneva solution that was implemented to resolve the performance problems for Keebler is described, including comparative processing metrics for the alternative architectures.
This paper should be used in conjunction with the Data Warehouse Size Estimation (DWSE) model and instructions available for download from the IT Knowledge Net under the topic “Estimating Report Process Requirements.”
Background
Experience inside and outside PW is demonstrating that the LIS, FIS, HIS, and EIS facilities of SAP are not adequate to support the full range of operational reporting or open information warehouse requirements for medium-to-large SAP implementations. Operational reporting and open information warehouse requirements in practice mean the ability to “slice and dice” the granular operational data captured by SAP applications for a variety of business purposes. Since our client base for SAP implementations consists of larger organizations, it is important for Price Waterhouse to identify up front when problems are likely to be encountered and be ready with solid recommendations on how requirements in this area should be accomplished.
“Data warehousing” frequently is assumed to be the solution for the functional void in reporting that needs to be filled. A problem with this terminology is that “data warehousing” has come to mean different things to different people. And in some quarters, lumping the problem of slicing and dicing granular SAP data under “data warehousing” has resulted in an inadvertent underscoping of the general reporting problem that needs to be solved.
Common concepts or topics that frame notions of data warehousing include: varying levels of data summarization, limitations on data content to the needs of particular business purposes (subject areas), time variant snapshots, focus on interactive usage and GUI presentation, performance measurement, limited scope pilot applications as a way to get started, and data warehousing software and hardware most widely discussed in the technology press. All of these things have their place under the right circumstances. But, approaching the problems being faced by big businesses with new SAP applications in these terms can be misleading with respect to the fundamental reporting problem that needs to be addressed.
Reporting Problem in General
Implementing a new SAP application means that the corresponding legacy system reporting framework being used to run the business is being replaced (presumably improved). Depending on the application, the old framework typically consists of hundreds to low single thousands of reports (on-line and hard copy). These reports were developed in response to business problems and ways of managing the enterprise that evolved over time. Certainly, a large portion of the legacy reports are obsolete and a new concept and framework for reporting will consist of many fewer more targeted reports. But, what is important here is that the mission critical reporting framework must be replaced as part of the SAP implementation. This is a general problem that should not be approached inadvertently with a set of limiting assumptions about what data warehousing is or is not.
Reporting problems come in varying sizes depending on the data basis and size of the reports in the mix. The data basis for a report means the number and size of data records that must be manipulated in order to produce the report. Report size means the number and length of the lines that constitute the final report output.[1] By far the largest single factor in determining overall reporting load is data basis.
The most important aspect of data basis usually relates to the number and size of records that must be extracted then further manipulated to produce the report output. However, under certain circumstances, the number and size of records that must be scanned and evaluated as candidates for extract can be the primary determination of data basis. In cases where the extract data basis is small, but large sequential table scans must be executed in order to identify the extract records, input table size becomes the relevant data basis for projecting reporting load[2].
In general, the size of an overall reporting load can be determined by aggregating the data basis and report sizes across the number of reports and frequency with which they will be executed in a given period of time. By stratifying reporting requirements in categories of on-demand, daily, weekly, monthly, quarterly, and annual, an accurate picture of report processing load over time can be projected[3]. It generally is a good practice to project detail reporting load separately from the summary reporting load.
Until an attempt is made to project the reporting load in this way, it almost certainly will be underscoped. Fortunately, most reports (largest number of reports) are low data-basis operational reports that typically are small in terms of data basis and report size. As a class, these reporting requirements do not contribute greatly to overall reporting load and do not need to be evaluated in detail. However, high data-basis reports tend to be comparatively few in number but account for the bulk of the overall reporting load. Underscoping risk primarily is in the area of high data-basis operational reporting requirements.
Low data-basis operational reports tend to deal with business problems involving open orders or transactions for individual customers, or other small subsets of data constrained to a limited period of time. Very often the indices that support SAP transaction processing also support the access requirements of operational reporting. Consequently, limited table scans are required to access the few records in the data basis for these kinds of reports. In general, the majority of low data-basis operational reporting requirements can be satisfied with a data basis under a hundred records and most with under a thousand, making them good candidates for on-demand processing. Even a large number of people executing these kinds of reports frequently will not create an unmanageable reporting load.
High data-basis operational reports tend to include requirements for retrospective analyses of transaction processing over time. High data-basis operational reporting requirements come from all major aspects of a business whether they be marketing, sales, product development, financial, production, human resources, procurement or legal to name some major constituencies. And all of these constituencies are interested in the basic transactions captured and processed by the SAP modules for many of their analytical purposes.
Keebler High Data-Basis Reporting Problem
Although the number of high data-basis operational reports tends to be dramatically smaller than the number of low data-basis reports, the data basis and size for these reports tends to be dramatically larger. The experience at Keebler clearly bears this out: in the original analysis of high data-basis operational reporting requirements, only 45 sales analysis reports were identified, but the data basis for these reports turned out to be approximately 23 gigabytes per week on average[4] (peak loads at end of period are much higher than the average indicates). Examples of these reports are included below:
- FS Sales Force Ranking
- FS Item Customer Pch: SIUs
- FS Item Customer Pch: Cases
- Food Service Ranking – ITEM
- Food Service Ranking – Customer
- Food Service Comparison CASES
- Food Service Comparison $$$
- Food Service Budget – PTD to HYTD
- Item Sales to Budget (Div.)
- Diversified Retail Sales – Final
- SBU Item Sales for Period: (by Sales Org)
- SBU Item Sales for Period: (SBU-Brand-Item) Corp Type
- Item Sales to Budget (Store Door)
- Budget Buster RANKED
- Final Sales BT
- Budget Buster
- Military Account Item
- Account Item – Trend & YTD
- Customer Purchase (Store Detail)
- Gain & Loss, w/ Allow.
- FS Cat. Grouping
As should be evident from the titles, these do not represent “nice to have” reporting requirements, but are blocking and tackling period-to-period comparisons of key volume statistics needed to run the company. The 23 gigabytes also does not include Keebler-specific requirements for data reorganization due to material, sales and other account hierarchy changes, legacy systems data integration, replacement of reporting currently outsourced to Synectics and substantial ad hoc requirements that are anticipated. Unless a detailed analysis of the high data-basis operational reporting requirements is done, it is easy to dismiss these kinds of basic reporting requirements as something that will be handled in background processes when time is available.
In order to understand whether a given reporting load could be handled in background when time is available, it is necessary to have some basic metrics about how fast this kind of processing can be done in a given environment. Assuming an HP T-500 8-Way world with EMC disk (the Keebler configuration), extract processing can be done at a rate of about 6 megabytes/minute (if table joins are required, calculations need to be adjusted to reflect processing at a rate of about 3,000 joins/minute). These numbers are consistent with information from SAP on performance in reporting and general Price Waterhouse experience with UNIX SMP machines running third-party relational data bases. In the Keebler case, this would mean approximately 65 hours per week of continuous processing just to complete the initial extract, assuming no table joins were required. Taking into account table joins would mean the basic extract processing would take about 260 hours of continuous single-threaded processing. Further, according to SAP, a general rule of thumb is that reports with a data basis of several hundred thousand records will require several hours to process (this is consistent with our Keebler observations). Considering that the 23 weekly Keebler gigabytes represent about 210 million extract records, something on the order of 2,000 processing hours per week would be a reasonable estimate (albeit a practical impossibility to implement) of the end-to-end processing load, given the Keebler environment.
Another consideration is that, according to SAP, report sizes in excess of 50 megabytes cannot be produced at all because of application server memory limitations (no Keebler attempt at this kind of reporting got far enough to verify this limitation). This would mean that reports would have to be split up (stacked), which in turn would increase the extract scanning load substantially.
* * *
To recap the Keebler experience, it was assumed at the outset that most reporting could be handled as a data warehouse problem through the SAP SIS and EIS facilities. Early experience with using these facilities highlighted the fundamental throughput problems and other alternatives were explored, including popular data warehouse tools. However, it was when the detailed analysis of the basic high data-basis operational reporting load was completed that the scope of the problem became apparent. No rationalization about data warehousing being limited to performance measurement or summary level numbers could eliminate the need to produce the reports or reduce the data basis required to generate them. Understanding the scope of the problem in terms of data basis was the key to focusing attention on architectural solutions that would work at scale.
Projecting Data Basis
Data basis is a function of:
- Transaction volume;
- Data structure complexity; and
- Number of reports, level of detail, and content requirements.
Transaction volume. Transaction detail represents the richest source of information about financial and other events captured by a system. As part of transaction processing, information entered about individual events is augmented with data from master tables according to business rules that constitute the accounting model in place at that point in time. Depending on SAP module and configuration options implemented, detail transaction files (e.g., SD COPA CE1 table) are posted in addition to various summary balances in the SAP data model[5].
In principle, a cumulative inception-to-date transaction file plus the related effective-dated reference tables could be the source data for all types of operational reporting. Projecting data basis for this reporting architecture would be relatively easy: total gigabytes of transaction files that would have to be scanned for each report, taking into account the number of reference table joins that would have to be performed as part of processing, extended by the frequency for reports over a period of time, would be the data basis for this kind of reporting load.
Taking the Keebler SD case as an example, 120,000 1,608-byte CE1 transaction records per day comes out to about 4.5 gigabytes per month or 111 gigabytes for the two years of history. The 45 basic reports actually represent an average of about 5 alternate sequences per report, so taking into account the repetitive aspects of daily, weekly, and monthly cycles, there are about 700 elemental reports that have to be produced to accomplish the basic high data-basis monthly reporting requirement. Producing one set of all reports directly off the detail would mean a data basis of something like 2.8 terabytes, clearly an impractical load to process at a rate of several hours per gigabyte, or even at a rate of several gigabytes per hour.
For audit trail or archive reporting purposes, there is no way around facing up to the volumes associated with cumulative transaction files, unless these requirements simply are ignored[6]. However, for most summary reporting purposes, effectively designed summary files can dramatically reduce the data basis required to accomplish these requirements. The degree to which data basis reductions can be realized though use of summary file schemes depends primarily on data structure complexity.
Data Structure Complexity. The simple physics of routinely reprocessing raw transaction data as the method for producing reports was the driver behind development of the manual accounting cycle. By determining the important summary totals required in advance, then classifying all transactions accordingly as they were journalized, detail could be archived period-by-period leaving a practical size data basis for report processing over time. In the manual world, this required maintaining a separate set of account structures and subsidiary ledgers for each summarization structure. General ledger accounting, cost accounting, revenue accounting, tax accounting, fixed asset accounting, inventory accounting, regulatory accounting, receivable accounting, payable accounting, and so on, all had needs for different sets of summary totals derived from various subsets and supersets of the same basic transactions. As automation of these reporting processes advanced through the ‘60s and ‘70s, the basic subsidiary ledger structure of the manual world was preserved in the subsystem architecture of computer-based applications.
As computers became faster at re-sequencing the same basic transaction set a variety of different ways, more granular account structures started to emerge in subsystem implementations. Product, organizational, and project dimensions started to be included in general ledger account structures by the early ‘80s simply because it became practical to extract, sort, and summarize a few hundred thousand to a million or so fully qualified summary accounts several different ways, something that was strictly impractical in a manual world. As a result, separate subsystems were no longer required for each business function that required a different roll-up of transaction detail. But, the determination of what could be consolidated and what had to be broken out in a separate subsystem continued to be arbitrated primarily based on the volume of fully qualified accounts implied by the dimensions included in the account classification structure.
SAP presents a highly integrated profile for transaction processing[7], which leaves the impression that highly integrated cross-dimensional views of the data captured also should be available. However, there are virtually an unlimited number of ways transaction-level data from SAP could be summarized taking into account all the possible cross-structural and time-delimited combinations. Fortunately, for a given implementation, patterns in the use of cross-structural combinations usually emerge that permit reporting data basis to be minimized by taking advantage of “locality” in the transactions with respect to account classification structures (i.e., maintaining summary files). Locality means that a large number of transactions create a much smaller set of combinations when summarized by a set of cross-structural dimensions. How substantial the locality effect is depends on transaction coding patterns, the cross-structural dimensions that are required given the patterns of report usage, and the number, breadth, and depth of the structures — data structure complexity.
The benefits of locality are usually substantial. But summary files are often assumed to be the “big” answer that makes the high data-basis operational reporting problem go away. The truth is that summary files quickly get larger than the detail files if a new summary file is created for each new use of the data that requires a different slice, which means that the summary files become a significant volume and maintenance problem unto themselves. In practice, summary files should be maintained to the point where the data basis reduction related to report production is greater than the data basis created by the need for summary file maintenance functions. In addition, summary files should be employed as sparingly as possible due to the substantial system administration requirements that attend their maintenance and use. In the Keebler case, only three (3) different cross-dimensional summary files maintained in multiple partitions by time-slice were required to satisfy these conditions, which is typical for data models of this type.
Modeling the degree of locality can be done fairly easily by using data from existing systems to calculate the collapse rate across structures. Three-to-six months of the two-to-four highest volume transaction types related to the structures in question usually is enough. Simply sorting the transaction files and calculating the average number of unique cross-structural key combinations by week, month and quarter will give a reasonably good picture of what kinds of collapse rates can be expected. The result usually is far less dramatic than is assumed in the absence of a detailed analysis.
Frequently, special reporting requirements will emerge that have not been (or cannot be) anticipated and are not supported by summary files. If the requirements relate to summary reports that will be produced with some frequency, the summary files can be modified and regenerated or new summary files can be created by reprocessing the detail transaction data. If the requirements relate to special requests with no pattern of usage, or if they are audit trail or archive requirements, or if requirements are that summary files reflect the current account structure hierarchies, there must be a way to process the transaction-level detail, or the requirements must be ignored. Said differently, unless all summary reporting requirements can be specified precisely at the outset, and audit trail, archive, or structure reorganization reporting is not a requirement, processing the transaction detail will be unavoidable. Summary files are not the “big” answer. They are just an important part of the solution.
Number of Reports, Level of Detail, and Content Requirements. Easily the biggest driver of data basis is the requirement to report at a low levels of hierarchies in cross-structural combinations. Subsystem reporting requirements typically are limited to summarizing data one structure at a time. As a result, the number of fully qualified accounts that get created by even large volumes of transactions is limited to the number of accounts in the given structure. By avoiding the need to report by customer/product/organization, vendor/SKU/location, employee ID/general ledger account, and so on, subsystem architectures limit their reporting data basis exposure — and consequently their usefulness.
Reporting at low levels of cross-structural detail usually is important because that is the level at which day-to-day resource allocation decisions are made. Inventory replenishment, sales force management and compensation, promotional campaigns, and crew scheduling are examples of large dollar investments managed in atomized quantities of resources, location-by-location, vendor-by-vendor, days at a time. High-level performance measures that show out of whack inventory turnover rates or sales per employee do not help identify the out-of-stock problems that need to be fixed or the particular sales calls not getting made. The thousands of reports in legacy systems got created because figuring out what was going wrong required a specific cross-structural slice of the data to illuminate the drivers about which something could be done.
It is unlikely that thousands of reports are needed to run any business at a given point in time. But, over time, the number of problems that need to be solved certainly accumulate into the thousands. In the world of subsystem architectures, a new problem meant building a new reporting subsystem (that mostly never get retired). In the integrated SAP world, the underlying assumption is that whatever slice is needed will be available because the transactions were captured by an integrated process. But, as we have seen, availability of any slice means access to detail or maintenance of every summary total (a clearly impractical alternative).
Two basic approaches to defining reporting level of detail and content requirements can be taken:
- Produce a pre-defined set of reports in case they are needed.
- Provide a framework that can generate almost anything, but produce only what people ask for.
The first approach is easiest to manage from a project standpoint. But, limiting the set of reports to a practical number is difficult. And it results in an enormous amount of processing for generating numbers nobody looks at. Also, it is not what most clients have in mind when they embark on implementing a new integrated information system. The second approach is preferable, but more difficult to achieve. Something that takes both into account is required.
An exercise that can be done very early in the project that promotes achieving the right balance is as follows:
- For the high-volume aspects of the modules being implemented, define the transaction-level data that constitutes the basis for operational reporting.
- Define the lowest level of cross-structural reporting that will be supported.
- Define the inter-period comparison (e.g., last year/this year, structure re-organizations) features that will be generally supported.
- Define a reasonably inclusive set of cross-transaction accumulators (e.g., promoted/not promoted sales, gross sales, returns, statistic 1, statistic 2, etc.) that will be generally supported.
- Define a basic set (20-40) of potentially high data-basis operational reports to be implemented that represent ranges in level of detail and content.
- Design the cross-dimensional summary files that efficiently support producing those reports over a two-year time horizon.
- Calculate the data basis for generating and maintaining the summary files and producing the reports.
(An Excel Data Warehouse Size Estimation (DWSE) model, with instructions, is available for download on the IT Knowledge Net to facilitate doing these data basis projections; see topic “Estimating Reporting Process Requirements.”)
The summary of results from the model for the current Keebler implementation are provided as follows:
| Frequency | Not Normalized | Total |
| Day | Sum of Report Count | 17 |
| Sum of Table Joins – Total | 124,818,052 | |
| Sum of Recs Read – Total | 42,960,000 | |
| Sum of MB Read – Total | 34,005 | |
| Sum of Records Extracted | 22,774,204 | |
| Sum of MB Extracted | 2,004 | |
| Week | Sum of Report Count | 54 |
| Sum of Table Joins – Total | 873,863,473 | |
| Sum of Recs Read – Total | 182,064,000 | |
| Sum of MB Read – Total | 173,751 | |
| Sum of Records Extracted | 57,880,800 | |
| Sum of MB Extracted | 5,708 | |
| Period | Sum of Report Count | 75 |
| Sum of Table Joins – Total | 507,524,187 | |
| Sum of Recs Read – Total | 506,832,000 | |
| Sum of MB Read – Total | 337,157 | |
| Sum of Records Extracted | 56,289,420 | |
| Sum of MB Extracted | 21,670 | |
| Quarter | Sum of Report Count | 2 |
| Sum of Table Joins – Total | 1,514,661,174 | |
| Sum of Recs Read – Total | 16,584,000 | |
| Sum of MB Read – Total | 7,500 | |
| Sum of Records Extracted | 10,209,000 | |
| Sum of MB Extracted | 876 | |
| Half year | Sum of Report Count | 9 |
| Sum of Table Joins – Total | – | |
| Sum of Recs Read – Total | 105,300,000 | |
| Sum of MB Read – Total | 89,771 | |
| Sum of Records Extracted | 19,908,000 | |
| Sum of MB Extracted | 6,993 |
Even though specific configuration details are not available early in the project, the drivers of data complexity, level of detail, and report content are sufficiently predictable based on existing business processes to yield very useful results. This exercise forces the scale issue to surface early so that informed decisions can be made about hardware and software platform. It illuminates the generalized nature of the reporting problem and promotes implementing a generalized solution rather than a one-program-one-report architecture.
Demonstrating a generalized solution helps with scope control because it is clear how new requirements can be accommodated as they evolve over time. It minimizes the tendency to define everything the existing system does plus everything new that can be thought of into the requirements. And it shows that so many possibilities exist that there is no hope of producing everything just in case somebody wants to use some of it.
Most importantly, this exercise makes it possible to make meaningful economic decisions about how much and what kind of reporting will be supported. The big drivers of cost in reporting are data basis and number of reports. By creating this model early in the project that can be exercised as new ideas are explored, expectations about reporting requirements and technology can be managed on a factual rather than emotional basis.
Components of a High Data-Basis Operational Reporting Solution
Given that SAP facilities alone are not adequate, something else is required. A basic assumption in the market is that some sort of data warehouse solution probably is the answer. In addition, the components of the architecture are widely assumed to be based around SMP or MPP hardware, a relational and/or multi-dimensional data base and some OLAP presentation-layer tools.
The problem is that the heavy data manipulation load associated with high data-basis operational reporting is not a process that works well on bus architecture machines using these kinds of access methods. Only by ignoring the high-volume aspects of reporting requirements can these kinds of solutions be expected to work in a cost-effective way.
Current SAP operational reporting/data warehouse strategies seem to fall into three major categories:
- Use SAP summary level reporting features (SIS, LIS, EIS, etc.) and access the data directly from SAP data structures to support very low data-basis operational reporting requirements. General “slicing and dicing” of granular detail cannot be supported. Practical limits on summary table size are in the 10,000s of rows.
- Extract SAP data and create a series of summary files in relational or multi-dimensional data bases for access by third-party data warehouse tools to support low-data basis operational reporting requirements. General “slicing and dicing” of granular detail cannot be supported. However, options for broader-based interactive access to pre-defined summary tables are available compared to native SAP facilities. Practical limits on summary table size are in the 100,000s of rows.
- Extract SAP data and create a separate operational data store containing detail and summary files as required. Use Geneva or custom COBOL/Assembler programs for extraction and reduction processing on an MVS machine. Use third-party data warehouse tools or SAP/ABAP facilities for presentation-layer functions on MVS, UNIX, or other platforms as required.
In low data-basis situations, or where reporting requirements can be constrained, or where reporting requirements can be precisely defined at the outset and remain stable over time, a creative implementation of Strategies 1 or 2 may be adequate. However, for larger clients with even medium transaction volumes and moderately complicated data structures, including an MVS-based operational data store in the architecture (Strategy 3) is a very practical solution for dealing with the inherent data bandwidth problem. In addition, the MVS environment provides for managing and achieving high throughput for the multiple concurrent batch processes characteristic of operational reporting problems. Complex batch streams with contingent dependencies are not similarly well supported in the UNIX world.
The Strategy 3 architecture that was implemented to solve the Keebler problem very successfully demonstrates the essential elements of a general solution:
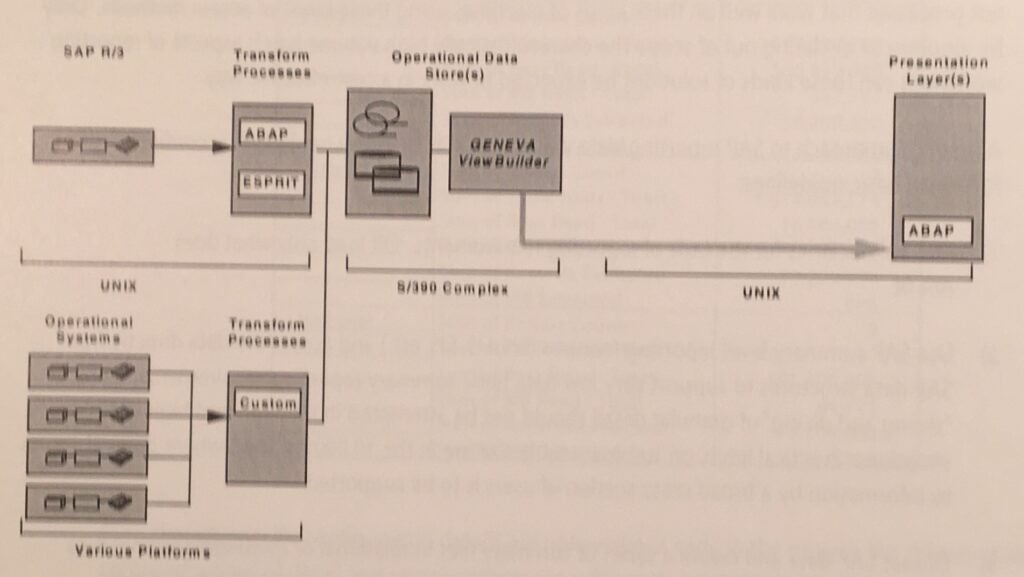
In this solution, the heavy data manipulation processes and archive requirements were off-loaded from the SAP UNIX machine. This left the SAP R/3 environment free to be tuned for transaction processing, unencumbered by extensive summary file posting requirements and accumulating detail data volumes. High data-basis report generation takes place on an outsourced MVS machine and answer sets are returned to the SAP/UNIX environment for access through an ABAP report viewer that appears to be a completely integrated part of the SAP application. It is an extremely cost-effective way to provide broad-based desk-top access to high-volume operational data.
Typical CPU and wall times for end-to-end processing of the reporting load described above using the Geneva engine are as follows:
Frequency CPU Time Wall Clock Time
Daily 15 min 1 hour
Weekly 150 min 3.5 hours
Period Summary File Build 300 min 8 hours
Period Reports 350 min 6 hours
(CPU/wallclock ratios vary due to differences in tape processing requirements, time of day the jobs are run, and whether the Geneva configuration is set up for single or multi-threaded processing — net result: cumulative processing time over the course of a month is approximately 26 CPU hours)
A more general presentation for high-volume situations that accounts for the various tool sets that could be employed would look as follows:
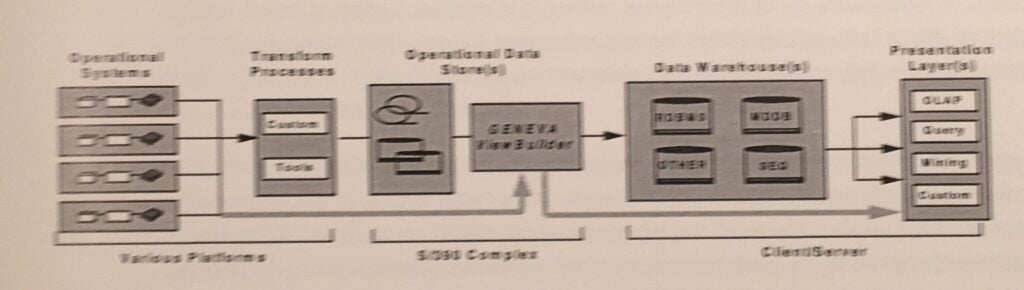
Event-level data from SAP, legacy, and other operational systems would be extracted and transformed using various tool sets as appropriate under the circumstances. The transform process would primarily deal with data cleansing issues (i.e., gaps, inconsistencies, and errors). Data reduction (i.e., summarization level and content) would be left primarily to the ODS component managed by Geneva or custom programs. The primary advantage of this separation is that this provides a systematic framework for re-running reductions over time as new requirements emerge. Reductions can be in the form of end-user report files delivered directly through some presentation layer, as was done in the Keebler case with ABAP on the UNIX machine. Or they can be data sets for downstream processes, including replacements or updates to relational or multi-dimensional data bases, data mining applications that require pre-processed inputs, or interfaces to other systems.
Absent an ODS component in medium- and high-volume situations, requirements must be defined very precisely at the outset, they must be stable over time, and limited to what the assumed technology platform can practically accommodate. As early SAP implementation experience has shown, long-range requirements are difficult to define. And volumes that can be feasibly accommodated are dramatically less than most imagine.
However, by incorporating an ODS on a high-data bandwidth platform for systematically reprocessing transaction-level data and maintaining/re-generating summary file structures, highly cost-effective and practical scale and flexibility can be designed into the architecture from the outset. SAP high data-basis operational reporting and data warehouse problems can be readily solved by using right tools for the right job in medium- and high-volume situations.
[1] For example, a data basis of all invoices for the last year would be a large data basis when compared to only invoices for yesterday, which would constitute a relatively smaller data basis. Last year’s invoices or yesterday’s invoices could be summarized at a high organizational level such as division, which would result in a small report size, or either data basis could be summarized by customer, item and week, which would result in a relatively larger report size.
[2] Detail (audit trail) reporting is a class of analytical reports that fits this profile. The general problem is to enumerate the detail transactions that support summary numbers accumulated as part of transaction processing, or summary numbers generated on other operational and analytical reports. Unless an index is available that permits going directly to the small subset of transactions required, sequential table scans are required to pick out the transactions that qualify for a given set of selection criteria. If the criteria require that table joins be executed as part of the processing, this needs to be accounted for accordingly.
While the extract data basis and consequent report sizes are small for the bulk of detail reporting requirements, the number of detail report requests can be substantial and the primary selection criteria can be based on any field in the data base, not just those with indices. The more robust the summary analytical reporting framework, the more demand there will be for detail reporting to substantiate the summary numbers. And the more likely it is that the robust summary numbers will be based on dimensions of the data base that do not have indices to facilitate selection processing.
[3] The nature of the processing necessary to produce reports also is an important factor. To the extent that the source data structures for a report are denormalized, or a report requires only a single table for input, data basis and size provide a good surrogate for describing reporting loads. To the extent that normalized structures are involved that force numerous table joins to be performed as part of extraction, calculation and formatting processes, projections of overall reporting load must be adjusted accordingly.
[4] The weekly data basis would have been over 20 times the 23 gigabytes if all processing had been done using transaction level data (basic transaction volume is 120,000 order lines per day @ 1,608 bytes per line). Based on the reporting requirements identified, summary file structures were defined that would reduce total data manipulation load necessary to produce the reports. As new reporting requirements emerged during development, summary files were repeatedly modified and regenerated from the transaction detail as necessary to support efficient production processing. It is expected that the summary file structures will continue to be modified and regenerated over time as new reporting requirements evolve.
[5] In some cases, obtaining detail transaction records from SAP is difficult for a variety of reasons. Since this is the richest source of information, as well as the basis for auditability of numbers generated by SAP, it is important that we resolve the open issues and develop consistent recommendations surrounding how all necessary transaction detail should be obtained from SAP, where it should be stored under varying volume situations, and how it should be accessed.
[6] Fortunately, audit trail reporting tends to involve large table scans but small extract sets, which means that processing subsequent to extraction is minimal.
[7] SAP highly integrates the interrelated aspects of transaction processing that traditionally have been disconnected by subsystem architectures. As transaction detail is captured in SAP, a very rich set of attributes about each business event is recorded. On a go-forward basis, business rules can be modified to accommodate new requirements or other changes over time. And SAP provides for posting a wide variety of summary records at transaction processing time to facilitate inquiry and operational reporting requirements. But, the determination of what summary totals will be required for each aspect of managing the business remains part of the up front configuration exercise. The ability to adapt to retrospective information requirements that were not foreseen up front, or new requirements that emerge over time, is very limited in the SAP world.
SAP will post only those summary totals that it is configured to post at the time a transaction is processed. No systematic facilities are provided for accessing or analyzing the rich detail that gets captured. There is no framework for mass regeneration of summary totals that are posted in error due to configuration problems. There is no general method for reorganizing data to reflect retrospective changes in account hierarchy relationships. SAP effectively addresses problems with transaction processing integration. But SAP does not effectively address integration problems related to high data-basis operational reporting.