The Problem
In 1996 a major US cookie manufacturer installed SAP to manage all aspects of the manufacturing, HR and financial operations. The system captured data and provided adequate information for managing most operational aspects of the business. But SAP could not deliver the detailed sales analysis necessary to support the highly detailed, store-specific sales process. They chose Geneva ERS to solve the problem in an integrated SAP environment.
The reporting requirements were substantial. The company required detailed information at the customer/line item level over various time slices from daily to year-to-date, for over 60,000 customer stores and 2,000 items, selecting and summarizing by over 100 fields. The company sells over a million items per week, and they needed comparative information for each time period for at least the last two years. They also needed comparative data be reorganized to reflect changes in organizational structure over time!
The Solution
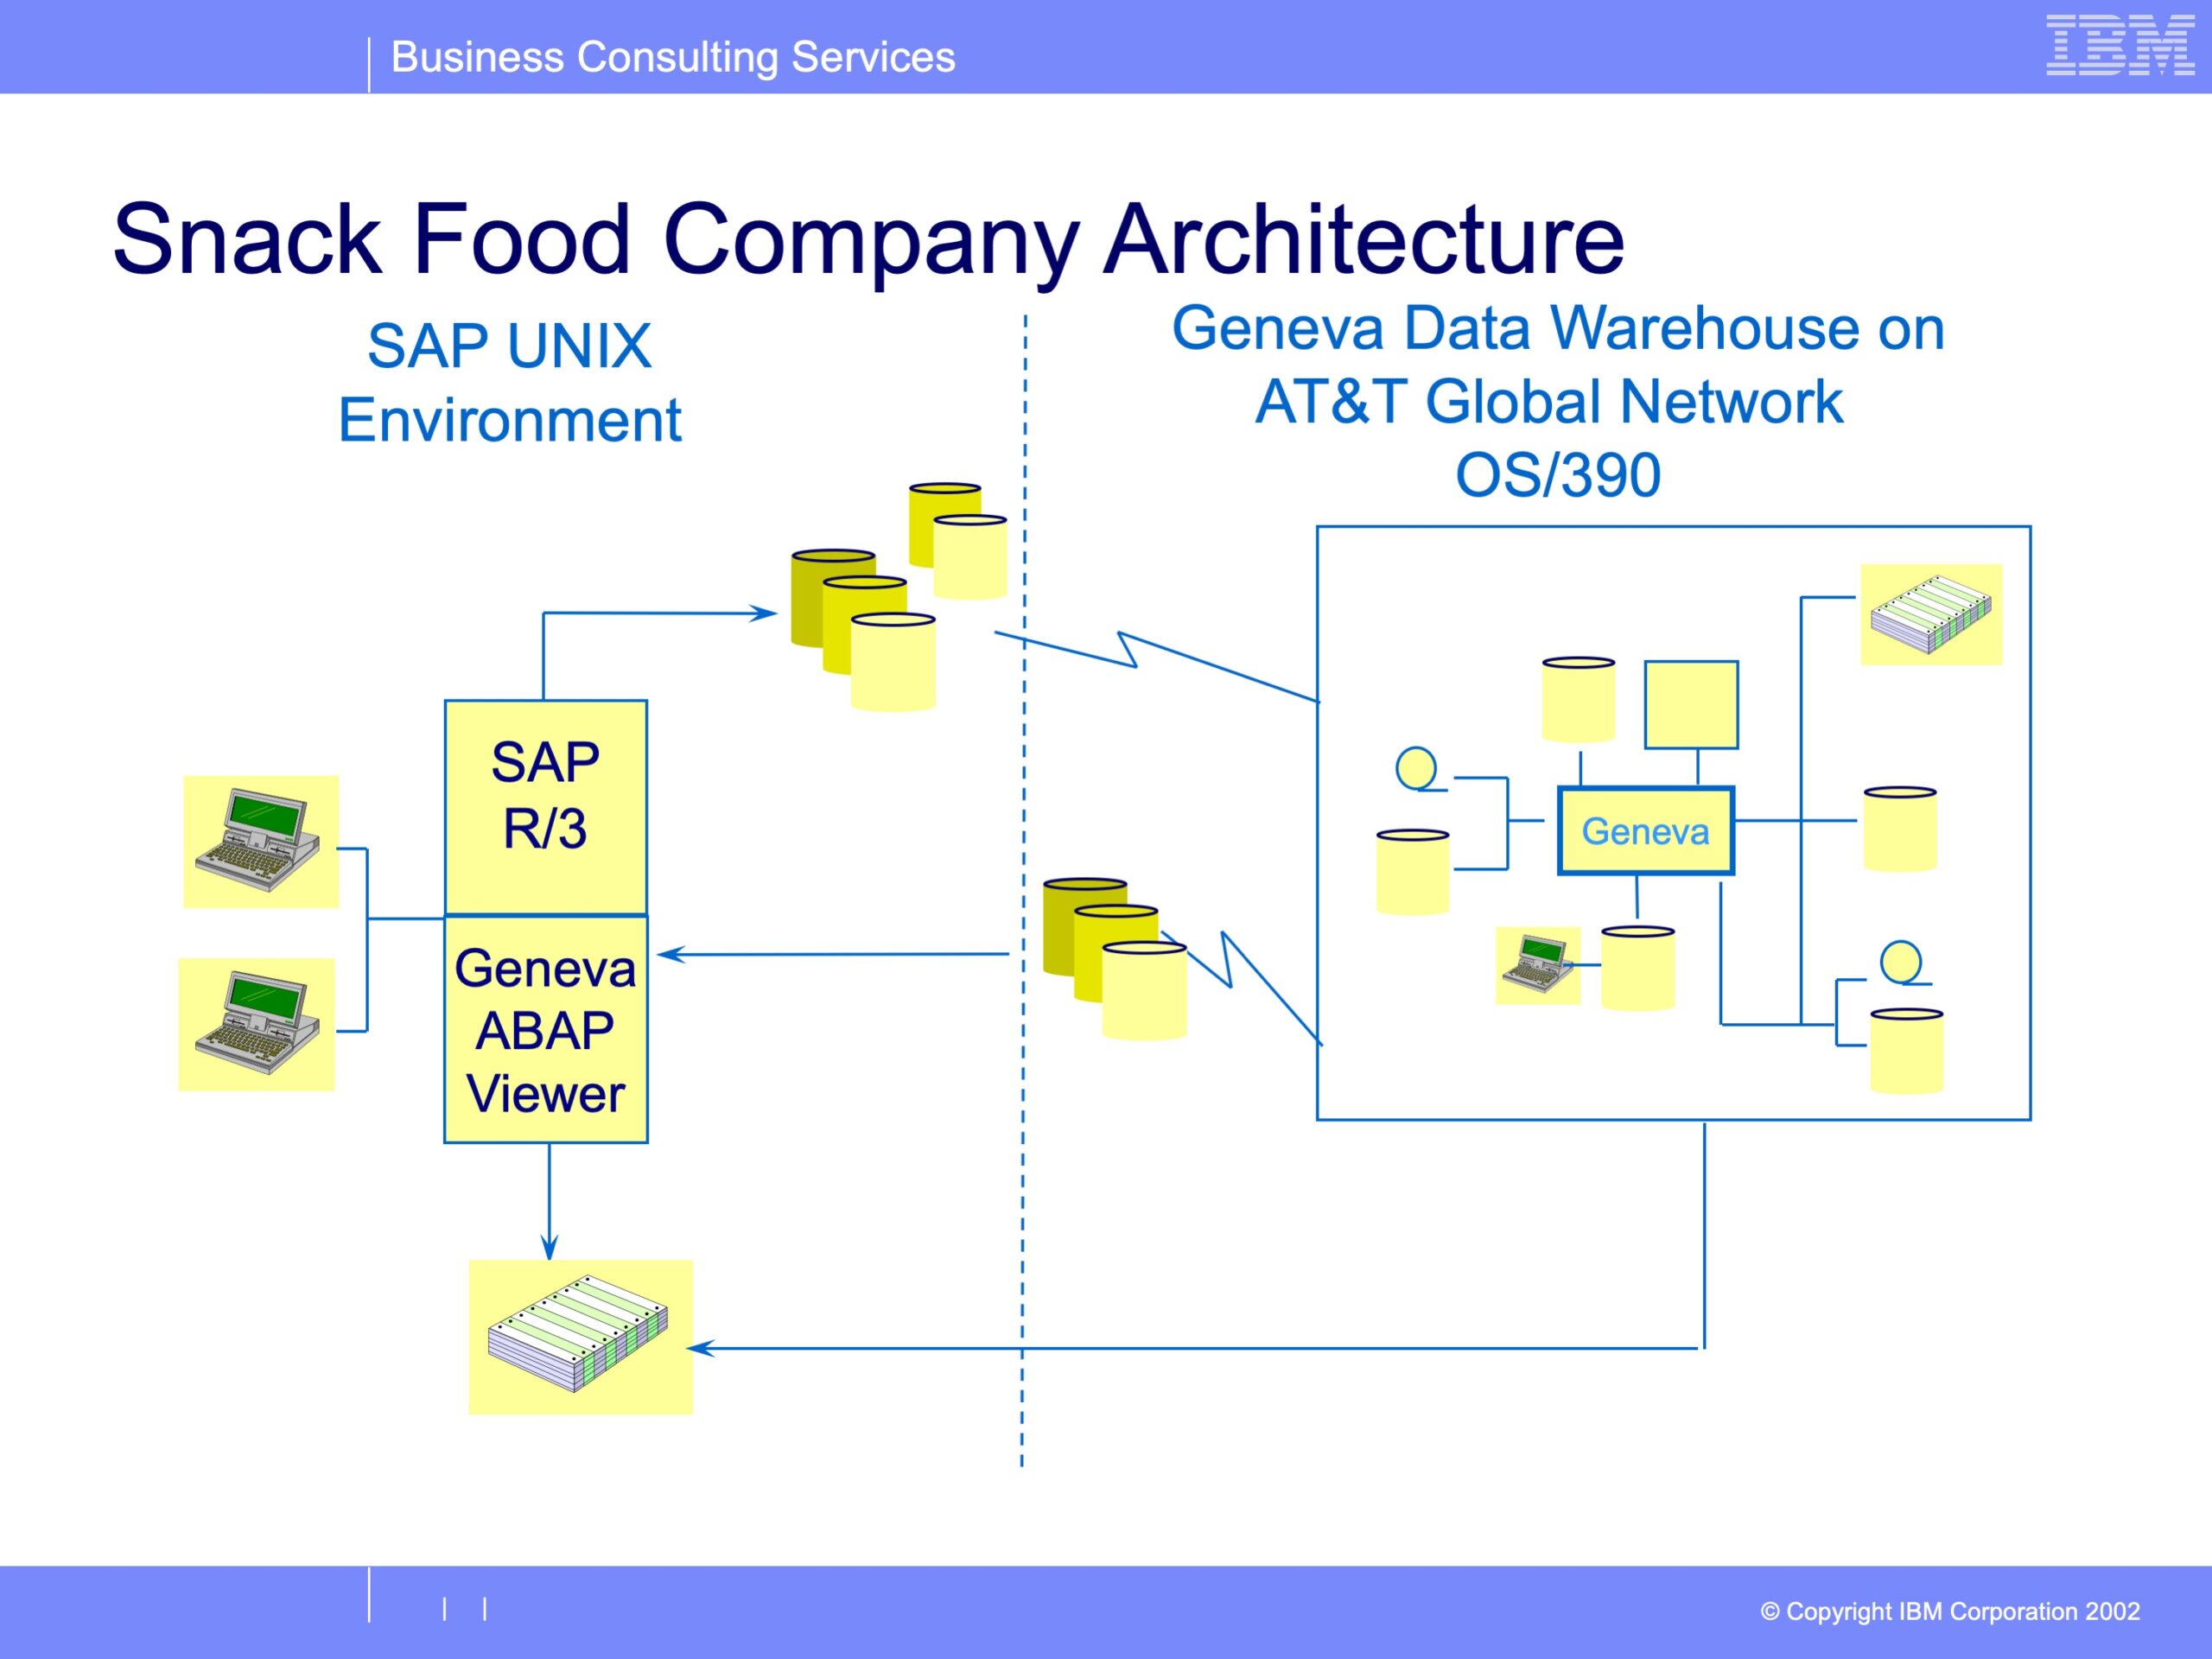
A Geneva ERS application was developed to deliver the full benefit of the SAP implementation, without burdening users with another tool. SAP’s Profitability Analysis module was configured to capture the required data. Programs were written to extract the sales items from SAP on a nightly basis. A series of Geneva ERS processes were developed to manage the data warehouse, including creation of various summary file structures. The completed data warehouse contains over 250 gigabytes of data in 15 entities, containing over 300 million records.
Geneva ERS was configured to produce executive information files, commonly called “information cubes.” The company defined Geneva ERS “Views” to create over 150 cubes, and 75 interface files. Geneva’s effective date lookup processing allowed for recasting the historical detail to reflect the current management structures.
The SAP Executive Report Viewer was also developed. Constructed within the SAP environment and fully integrated with the Profitability Analysis reporting, this analysis tool gives users a single source of information. Through this tool, users are able to select a time period, and then the respective cube. Users can specify selection criteria, drill down into reports to lower and lower levels of detail. They can export to Excel, view the data in a graphical format, format the report, and save a profile of the report.
The Results
Users have commented that the sales reporting system has been one of the most successful components of the SAP implementation. It has allowed the company to capitalize on it national sales force that makes personal contact with stores nearly 3 times each week. The sales representatives are armed with needed information. They can analyze customer and product information for daily, weekly, monthly, year to date, and spot trends from over 3 years of data. The system has helped fuel their growth in net income nearly 10 times from 1996 to 1999, and has scaled as the company has purchased and integrated three additional companies.
More about this time can be read in Balancing Act: A Practical Approach to Business Event Based Insights, Chapter 21. ERP Reporting.